High-Performance Thin-Layer Chromatography (HPTLC)
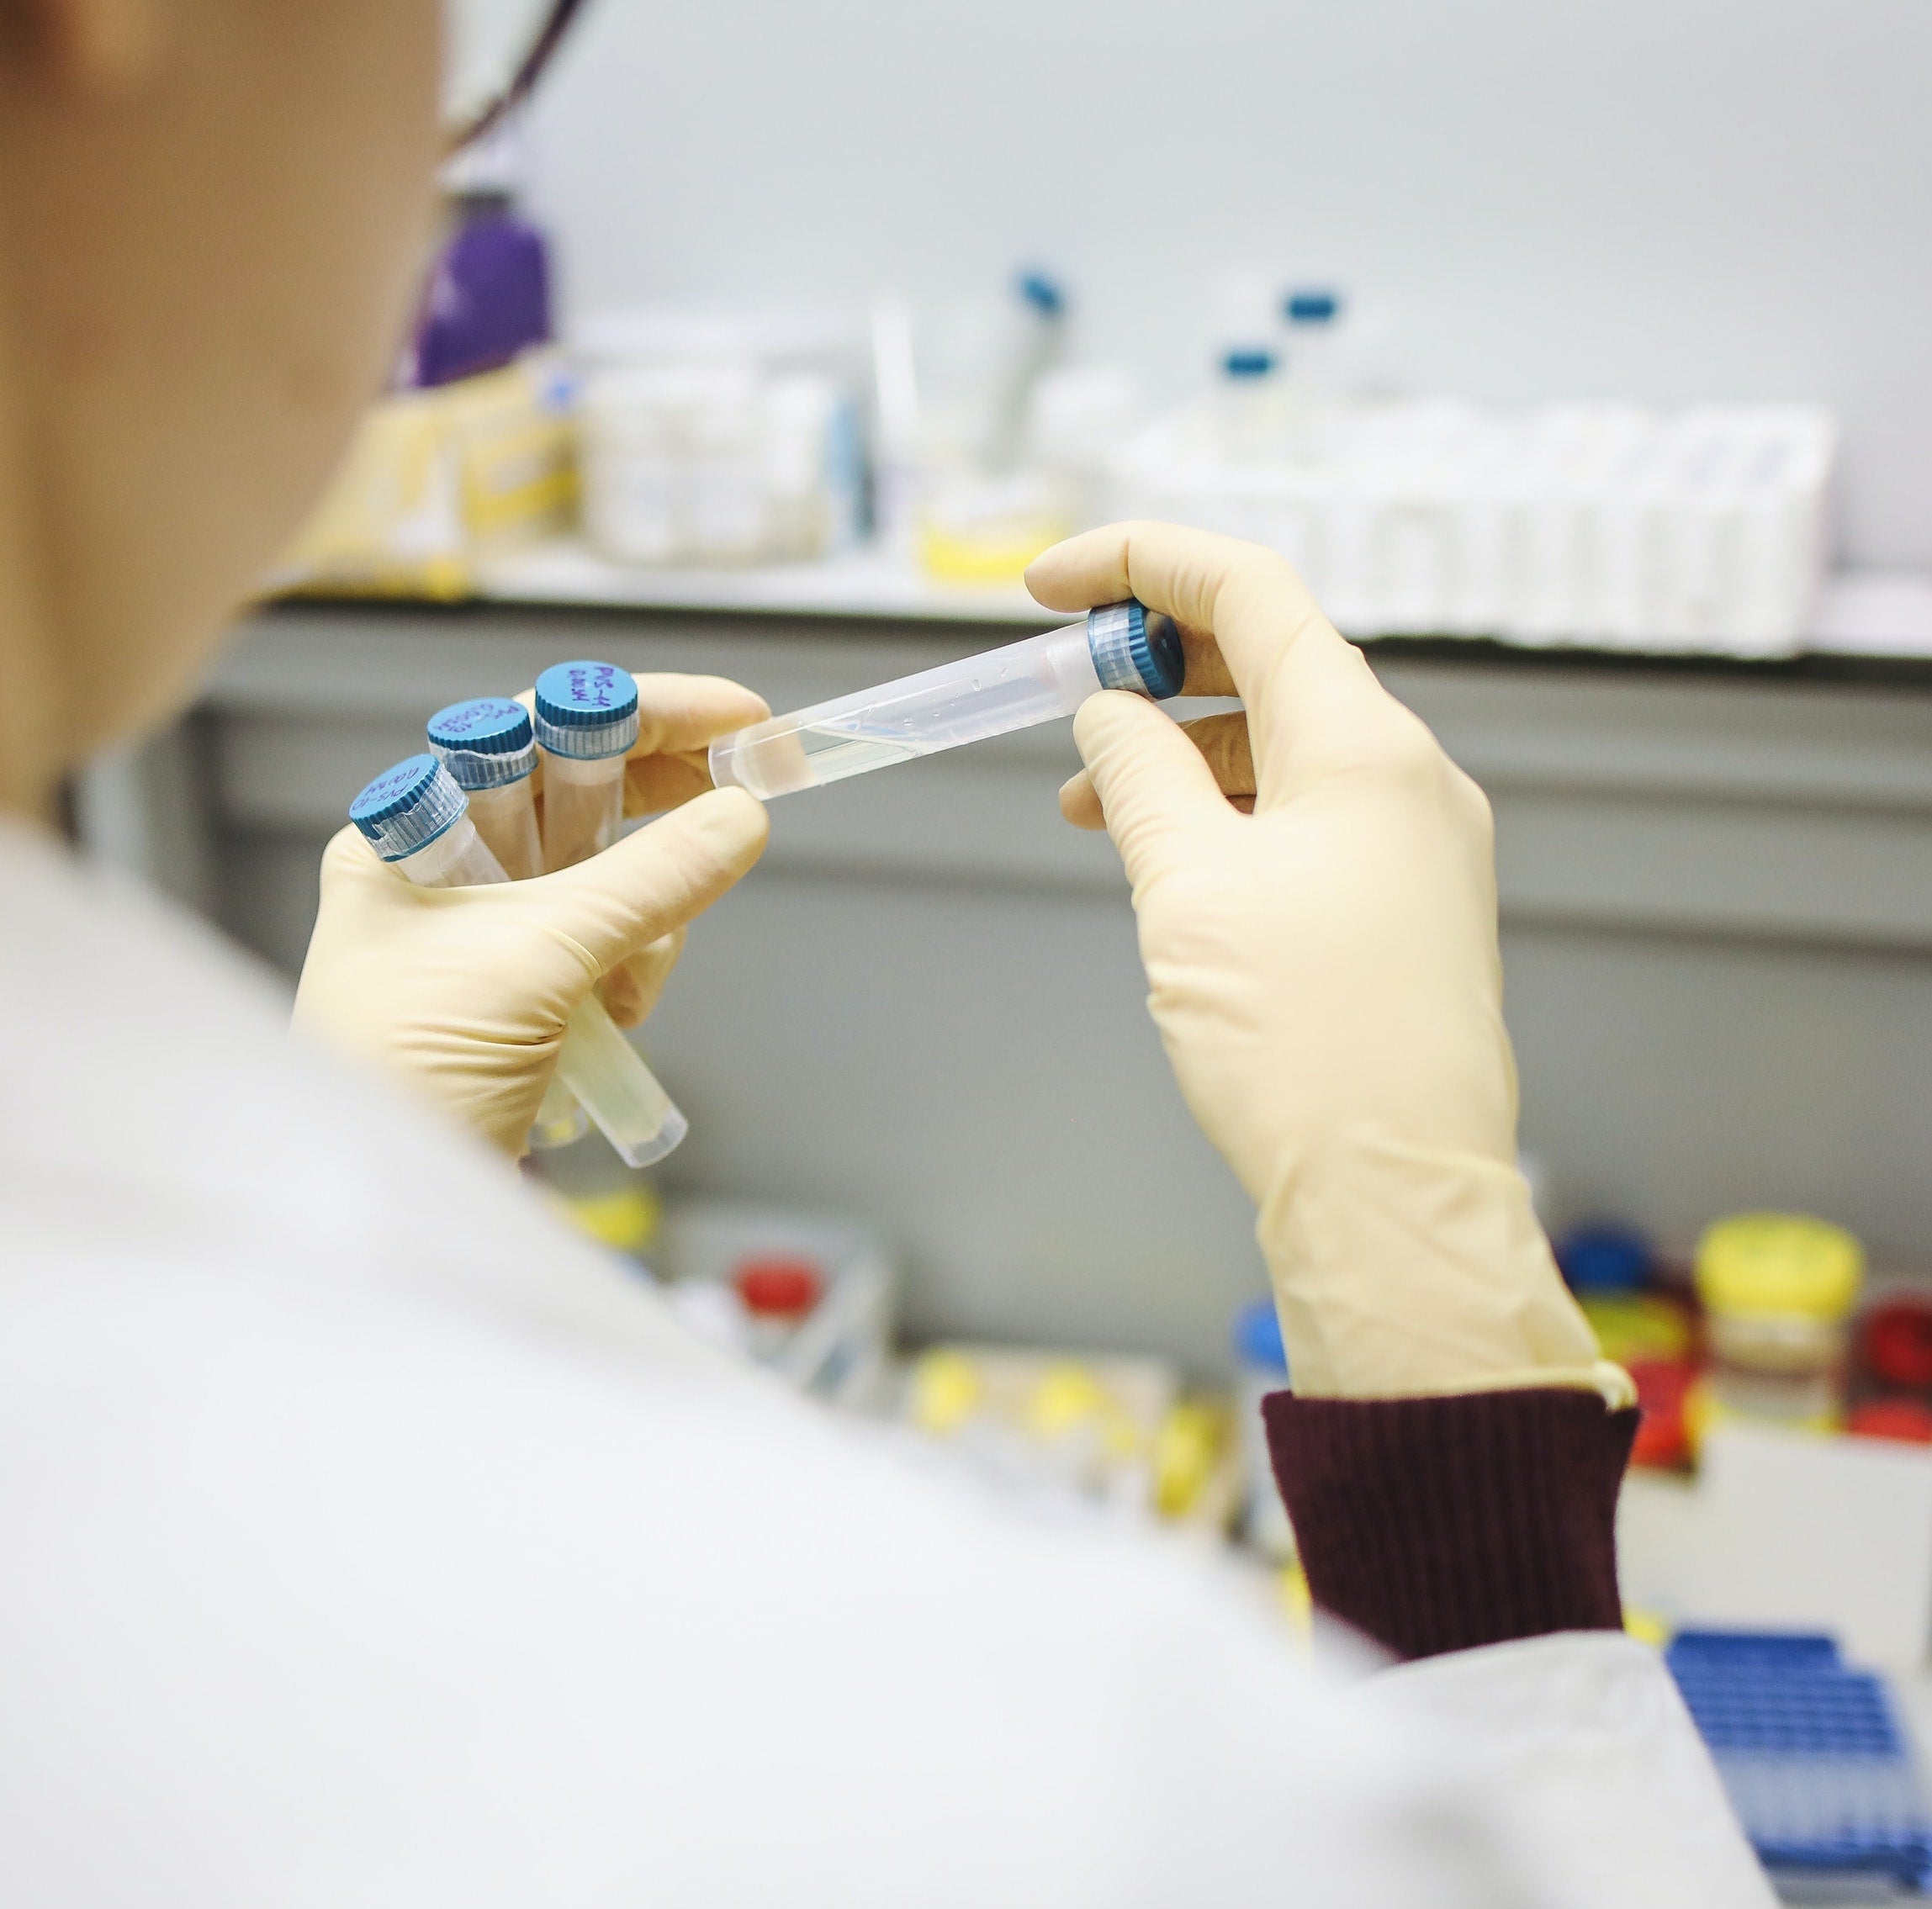
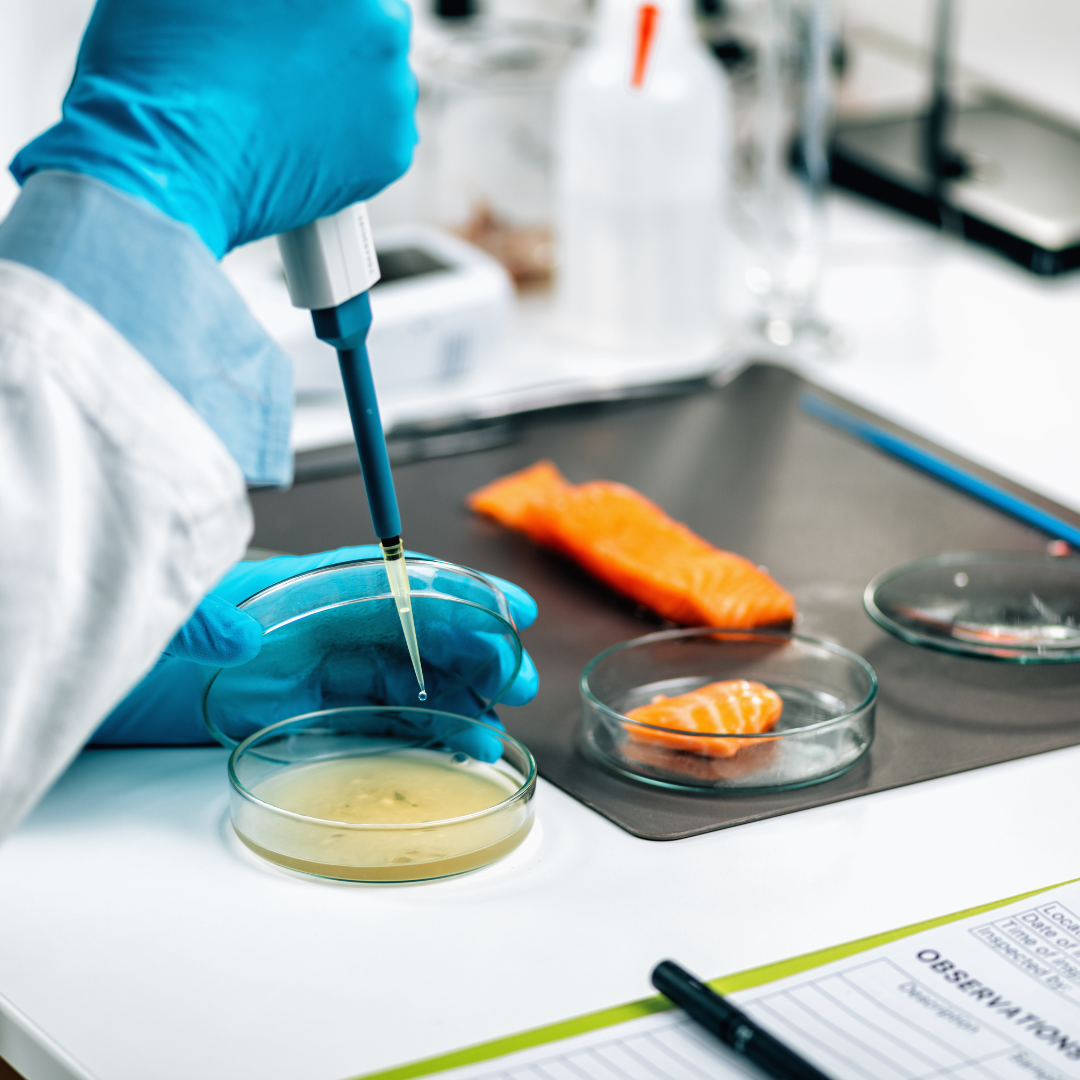
High-performance thin-layer chromatography (HPTLC) is a powerful analytical technique that relies on polarity differences to separate the components of a mixture. HPTLC is used to assess substance purity and identify constituents and active substances in a mixture.
Pharmaceutical analysis, food and drug analysis, environmental analysis, biochemistry, and most chem-based fields depend on HPTLC.
HPTLC is an enhancement of ordinary thin-layer chromatography (TLC) and follows a nearly identical process to TLC. It will be easier to understand HPTLC if you first have a basic understanding of ordinary TLC.
What is TLC?
TLC is a sub-class of planar chromatography. It is a common technique because it is fast, cheap, and sensitive.
Like all chromatography techniques, TLC has a stationary and a mobile phase. Differences in the polarity and interactions with both phases drive the separation of a sample.
Stationary Phase
The most common stationary phases for TLC plates (AKA chromatoplates) are silica gel and alumina. What kind of compounds are being separated will determine the best stationary phase for use. For example, silica gel separates amino acids and hydrocarbons well but poorly separates basic molecules.
The stationary phase is almost always polar, called normal phase TLC. However, non-polar stationary phases also exist, called reverse phase TLC.
Mobile Phase
No ‘one answer fits all’ exists for choosing an appropriate solvent for the mobile phase of TLC. The selection process is tricky and analyte-specific. It is common to use a mixture of solvents to optimize separation (referred to as a solvent system).
The mobile phase polarity determines how quickly and effectively separation occurs. Retention factors (Rf), or the distance traveled by the sample divided by the distance traveled by the solvent, are a way to decide if the solvent provided good separation. Rf’s are also used to identify the analyte.
The desired separation will not occur if the Rf is too high or low.
An appropriate solvent will exploit the differences in the polarity of the sample components. If the strength of the interactions between the solvent and compounds vary, the resulting TLC plate will have a good resolution.
Spotting, Development, and Visualization
After selecting an appropriate stationary and mobile phase, the setup and procedure of TLC are easy. For the sake of simplicity, assume the stationary phase is polar.
A wide-mouth jar is an appropriate development chamber for TLC. Just enough solvent is placed into the development chamber to cover the bottom.
A straight line is drawn about 1 cm from the bottom of the TLC plate. Samples are spotted using a glass capillary onto this line. This line must be high enough so that the solvent does not reach it when placing the TLC plate into the development chamber.
Once in the chamber, the solvent will start moving up the TLC plate due to adhesion. It is during this time that separation occurs. As the solvent moves up the plate, it passes over the sample. More polar components will interact more strongly with the stationary phase than with the solvent. These components will stick to the stationary phase and thus not travel as far as non-polar components.
The more non-polar components of the sample will interact more strongly with the mobile phase than with the plate. They will be carried with the solvent further up the TLC plate.
The plate is removed from the development chamber before the solvent reaches the top of the stationary phase. The solvent front is marked.
At this point, there are numerous ways to visualize the separation. The technique used depends on the identity of the separated components. Ultraviolet imaging and Iodine or Permanganate staining are among the most common methods.
For Ultraviolet imaging, a dye that fluoresces under UV light is used to rinse the stationary phase. The interaction between the stain and components on the plate prevents fluorescence. Thus, samples appear as dark spots on the plate.
Staining methods work similarly. Iodine interacts with most organic compounds; dark spots appear on the plate where a sample is present.
The sample components appear as dots. Retention factors are calculated, and the identity of substances is determined.
HPTLC versus TLC
High-performance thin-layer chromatography works on the same fundamental principles as TLC. However, HPTLC is faster, more efficient, and achieves greater separation than standard TLC.
HPTLC is automated (versus manual TLC), which reduces human error. The samples in HPTLC are visualized as lines, whereas TLC samples are visualized as spots. However, most of the differences between HPTLC and TLC are due to their differing plates.
HPTLC plates contain smaller particles (mean of 5-6 um) than ordinary TLC plates (mean of 10-12 um). HPTLC plates are also shorter and thinner than TLC plates.
Smaller particle size gives these gels a higher packing density and a smoother surface. The increased packing density and smoother surface reduce smearing and increase detection sensitivity and resolution.
The thinner and shorter chromatoplates are why HPTLC runs take only 3-20 minutes, whereas TLC can take 20-200 minutes.
The use of thinner plates also contributes to increased sensitivity. The lowest quantities TLC can detect via fluorescence visualization is 50-100pg of a substance. But with the same visualization technique, HPTLC is sensitive to 5-10pg.
Additionally, more samples can be run at one time using HPTLC (over 30) than TLC (less than 10).
Why HPTLC?
There are many kinds of chromatography, including gas chromatography (GC) and high-performance liquid chromatography (HPLC). Why use HPTLC for sample analysis versus another technique?
HPTLC is one of the best techniques to analyze highly complex mixtures of compounds. For this reason, it dominates the herbal drug and botanical analysis field.
The composition of plant materials, such as Ginseng, varies depending on the growing conditions and plant development stage.
It is hard to determine quality standards for a botanical sample using many techniques because each sample component usually must be evaluated separately.
HPTLC can be used to generate an overarching quality standard (known as a fingerprint) of a botanical. Fingerprints make it much easier to analyze what components are present and assess purity in a sample. The reproducibility of HPTLC aids in the validation of a good quality standard.
HPTLC also takes much less time and requires little solvent or sample preparation.
CTLA HPTLC Testing Services
The FDA requires that all ingredients used in supplement manufacturing are pure. We confirm that by using high-quality analytical techniques.
CTLA offers qualitative HPTLC testing of botanicals using silica gel and numerous solvent systems. Our services can ensure that your botanical ingredient is uncontaminated.
As an ISO/IEC 17025:2017 certified lab, CTLA testing will inspire confidence in your nutritional supplement.
Contact us today to discover how we can assist you in confirming your product and ingredients meet quality standards.
Article written by Jae O. Haroldsen
Sources:
“HPTLC”. Millipore Sigma. 2021. https://www.emdmillipore.com/US/en/analytics-sample-preparation/learning-center-thin-layer-chromatography/hptlc/NGub.qB.fCoAAAFVPmJDx07N,nav
“Thin-layer Chromatography”. Chemistry Libretexts. 2019. https://chem.libretexts.org/Ancillary_Materials/Demos_Techniques_and_Experiments/General_Lab_Techniques/Thin_Layer_Chromatography
“What is Planar Chromatography?” Chromatography Today. 2015. https://www.chromatographytoday.com/news/solid-phase-extraction-spe/34/breaking-news/what-is-planar-chromatography/33875
Attimarad, Mahesh et al. “High-performance thin layer chromatography: A powerful analytical technique in pharmaceutical drug discovery.” Pharmaceutical methods vol. 2,2 (2011): 71-5. doi:10.4103/2229-4708.84436
Shivatare, Rakesh & Nagore, Dheeraj & Nipanikar, Sanjay. “'HPTLC' an important tool in standardization of herbal medical product: A review”. ResearchGate. 2013. https://www.researchgate.net/figure/Difference-between-TLC-and-HPTLC_tbl1_306393619
Nichols, Lisa. “Separation Theory”. Chemistry Libretexts. 2022. https://chem.libretexts.org/Bookshelves/Organic_Chemistry/Organic_Chemistry_Lab_Techniques_(Nichols)/02%3A_Chromatography/2.03%3A_Thin_Layer_Chromatography_(TLC)/2.3D%3A_Separation_Theory
UCLA. 2015. https://www.chem.ucla.edu/~bacher/General/30BL/tips/TLC1.html
“High Performance Thin-Layer Chromatography Plates”. Millipore Sigma. https://www.emdmillipore.com/US/en/products/analytics-sample-prep/chromatography-for-analysis/thin-layer-chromatography/high-performance-thin-layer-chromatography-plates-hptlc/utyb.qB.3hoAAAFAnOhkiQpx,nav?ReferrerURL=https%3A%2F%2Fwww.google.com%2F
Reich, Eike et al. “Validation of high-performance thin-layer chromatographic methods for the identification of botanicals in a cGMP environment.” Journal of AOAC International. 2008. https://www.ncbi.nlm.nih.gov/pmc/articles/PMC2662610/
Umass.edu. https://people.chem.umass.edu/samal/269/tlc.pdf
“Dietary Supplement Health and Education Act of 1994 Public Law 103-417 103rd Congress”. NIH. 1994. https://ods.od.nih.gov/About/DSHEA_Wording.aspx#sec9


